
Accelerating adoption of an asset intelligence AI product.
Product direction, a working Esri prototype and shared design standards to help a complex asset intelligence product move towards wider adoption.
At a glance
- Make a technically capable product easier to understand and use across government and councils.
- Strategic UX review, interface redesign, Esri prototyping and design governance.
- A build-ready product direction, development specifications and shared standards for delivery teams.
- Proof of concept towards production rollout.
Fig 01 / Holistic product model
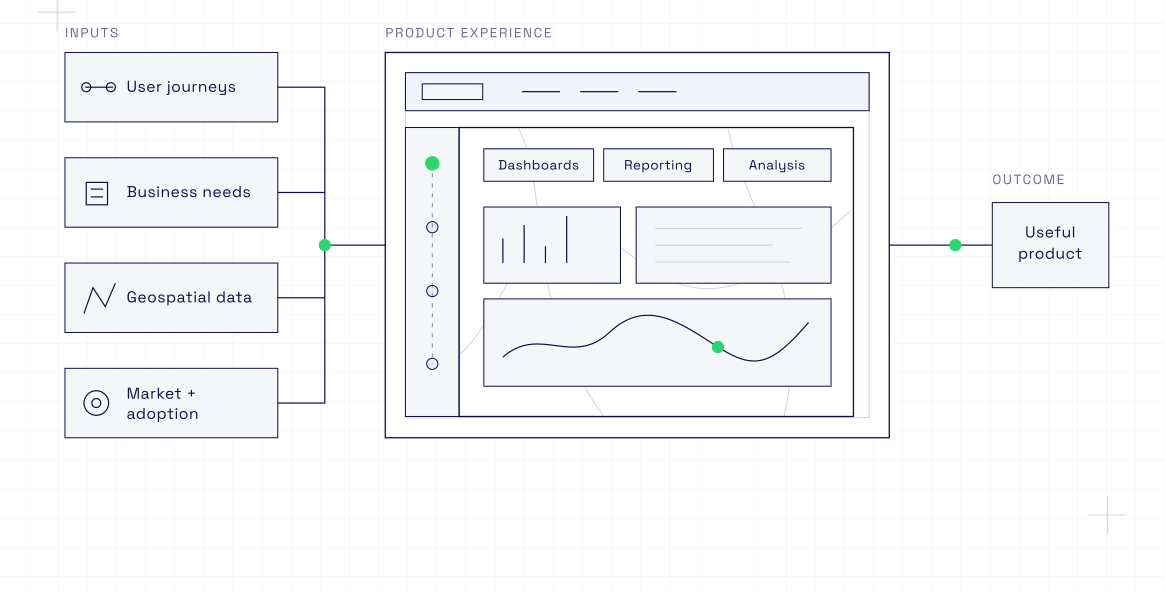
Conceptual illustrations based on project work; client details have been omitted.
The full case study continues below
The context
The AI-enabled asset intelligence product had demonstrated significant technical potential and attracted an initial group of users. To deliver on the broader goals of the initiative, it now needed to support greater uptake and more consistent use across government and councils.
The product brought together complex asset information, spatial data and AI capabilities. Although that capability was valuable, the experience made it difficult for people to understand what the product could help them do and how its different tools fitted together.
As the product moved towards production, the organisation also needed a stronger foundation for coordinating product, design and engineering decisions across multiple teams.
Understanding the product as a whole
We reviewed the product in the context of its users, workflows, data, technology and intended role across government and councils.
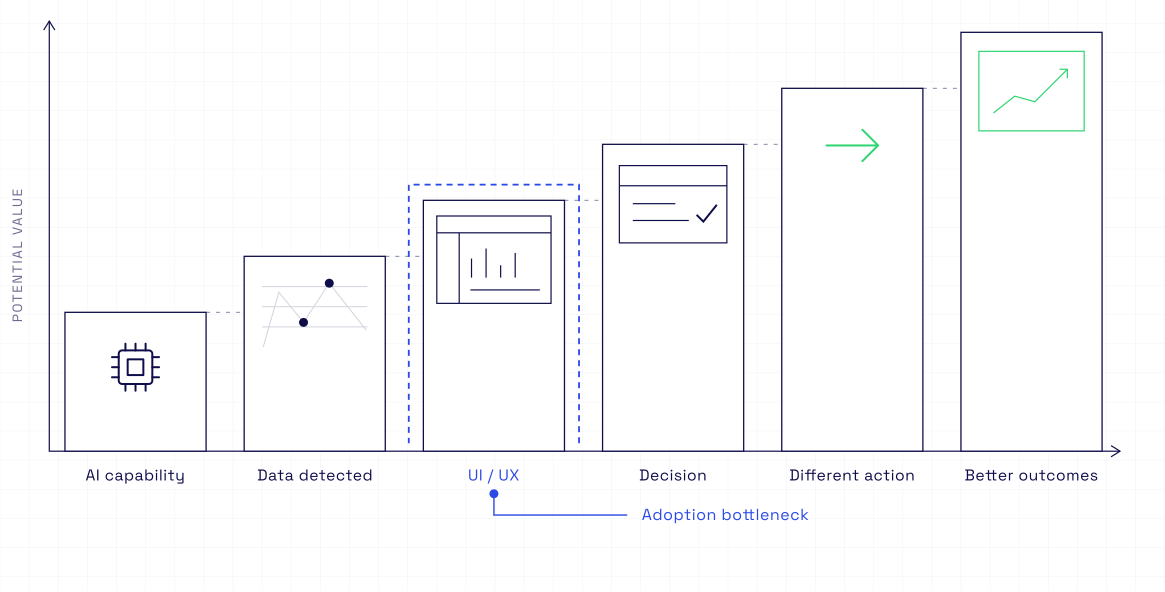
Rather than treating individual interface issues in isolation, we examined how the overall experience helped people understand network conditions, investigate assets and decide what action to take next.
This identified immediate usability improvements alongside broader opportunities to clarify the product structure, navigation, terminology and relationships between its different capabilities.
Fig 02 / Decision value chain
Establishing a clearer direction
We translated the findings into a strategic redesign that connected the user experience with the purpose of the product and its path towards wider adoption.
The new direction reduced unnecessary complexity, clarified the role of each workspace and created more consistent ways to explore information, apply filters and move between network-level insights and individual asset details.
It also gave the team a clearer view of what needed attention immediately, what could develop over time and how future capabilities could be introduced without fragmenting the experience.
Making the direction buildable
The work extended beyond recommendations and interface concepts.
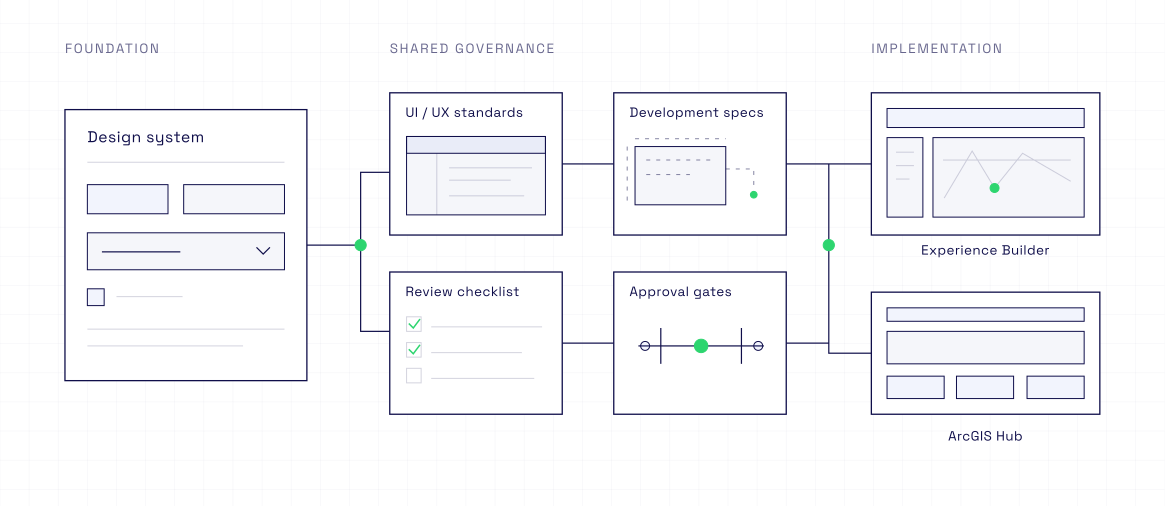
We created a working prototype using ArcGIS Experience Builder and ArcGIS Hub, demonstrating how the proposed product structure, navigation, workflows and interface patterns could operate within the available Esri technology.
Detailed specifications gave development teams practical guidance for implementation. We also mapped the organisation’s enterprise design system into the Esri environment, identifying how its principles and components could be applied and where the platform required adaptation.
Supporting consistent delivery
Because the product was being developed in a multi-party environment, we established a design governance framework and practical interface standards for the teams involved.
These provided a shared basis for assessing new requirements, resolving design questions and maintaining coherence as different teams and vendors contributed to the product.
Fig 03 / Governance and delivery
What the work established
- A strategic UX and interface review
- Prioritised recommendations for increasing usability and uptake
- A redesigned product structure and experience
- A working ArcGIS Experience Builder and ArcGIS Hub prototype
- Detailed specifications for development
- Alignment with the organisation’s enterprise design system
- UX governance and interface standards
- Decision principles for future development
- A clearer foundation for production rollout
