
Designing a data publishing platform for Ocean Accounting.
Platform and experience design for an open-source Ocean Accounting proof of concept, connecting accessible spatial exploration with traceable data and methods.
View source on GitHub (opens in a new tab)At a glance
- Make complex Ocean Accounting data accessible while preserving provenance, traceability and repeatable publishing.
- Product definition, spatial information architecture and UX design alongside UNSW and Auspatious.
- A connected catalogue, mapping and analysis experience, with prototypes and guidance for development.
- Proof of concept and design support into development.
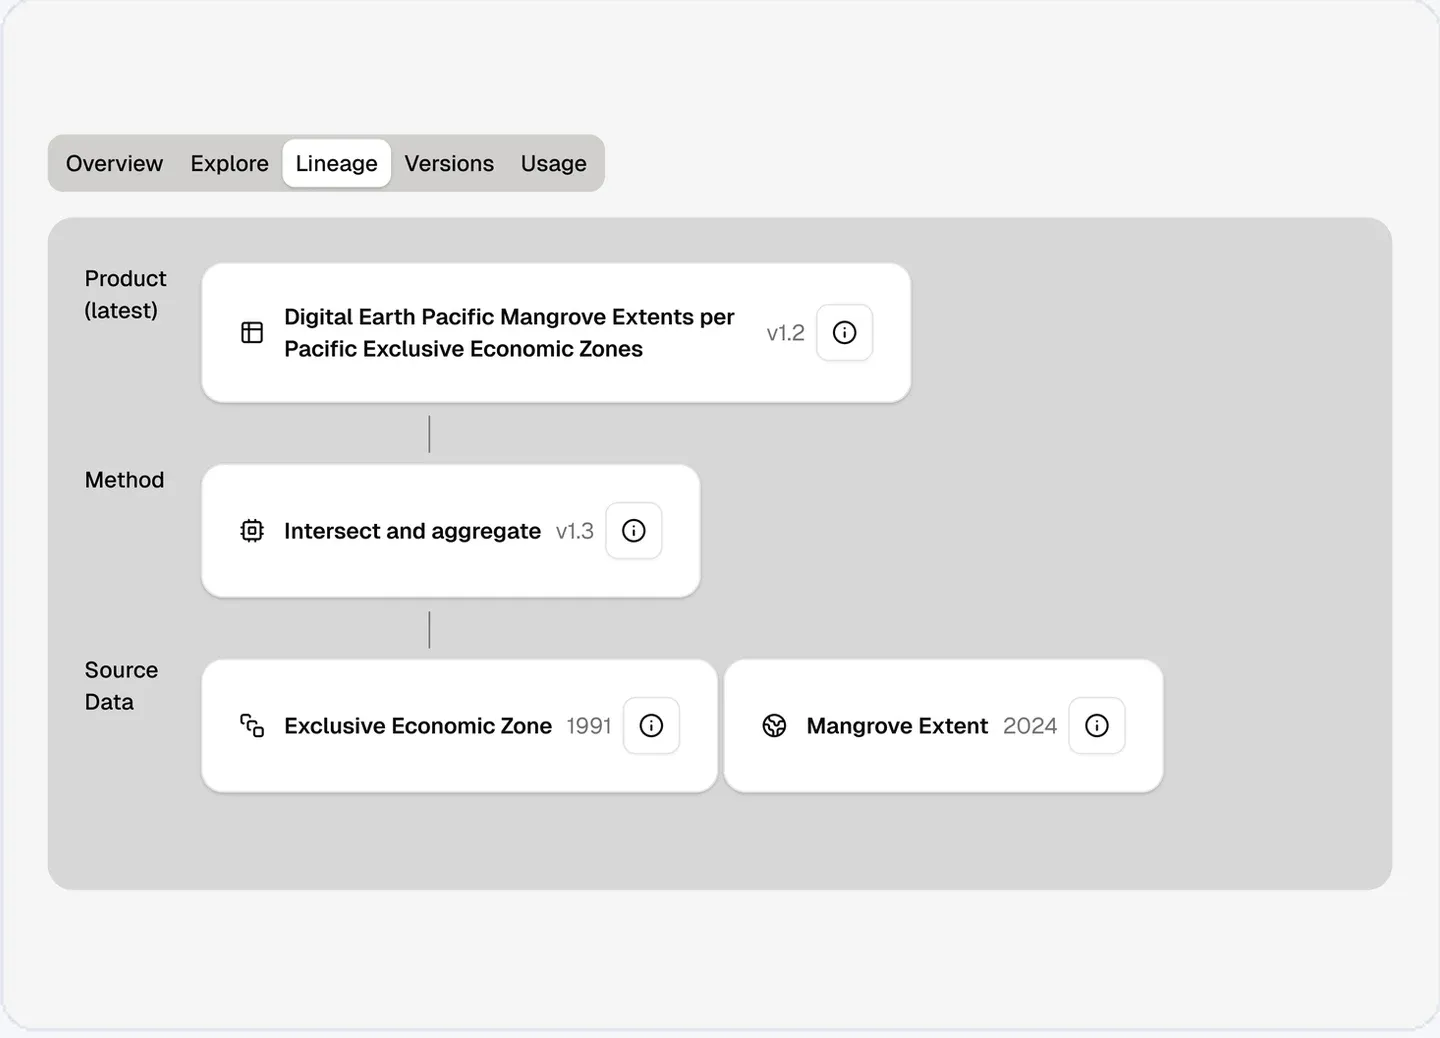
Traceable inputs and methods
The full case study continues below
The context
Ocean Accounting brings environmental, social and economic information together to support a more complete understanding of ocean systems and better-informed decision-making.
The UNSW Centre for Sustainable Development was exploring how large and varied datasets could be published, analysed and made accessible through a scalable digital platform.
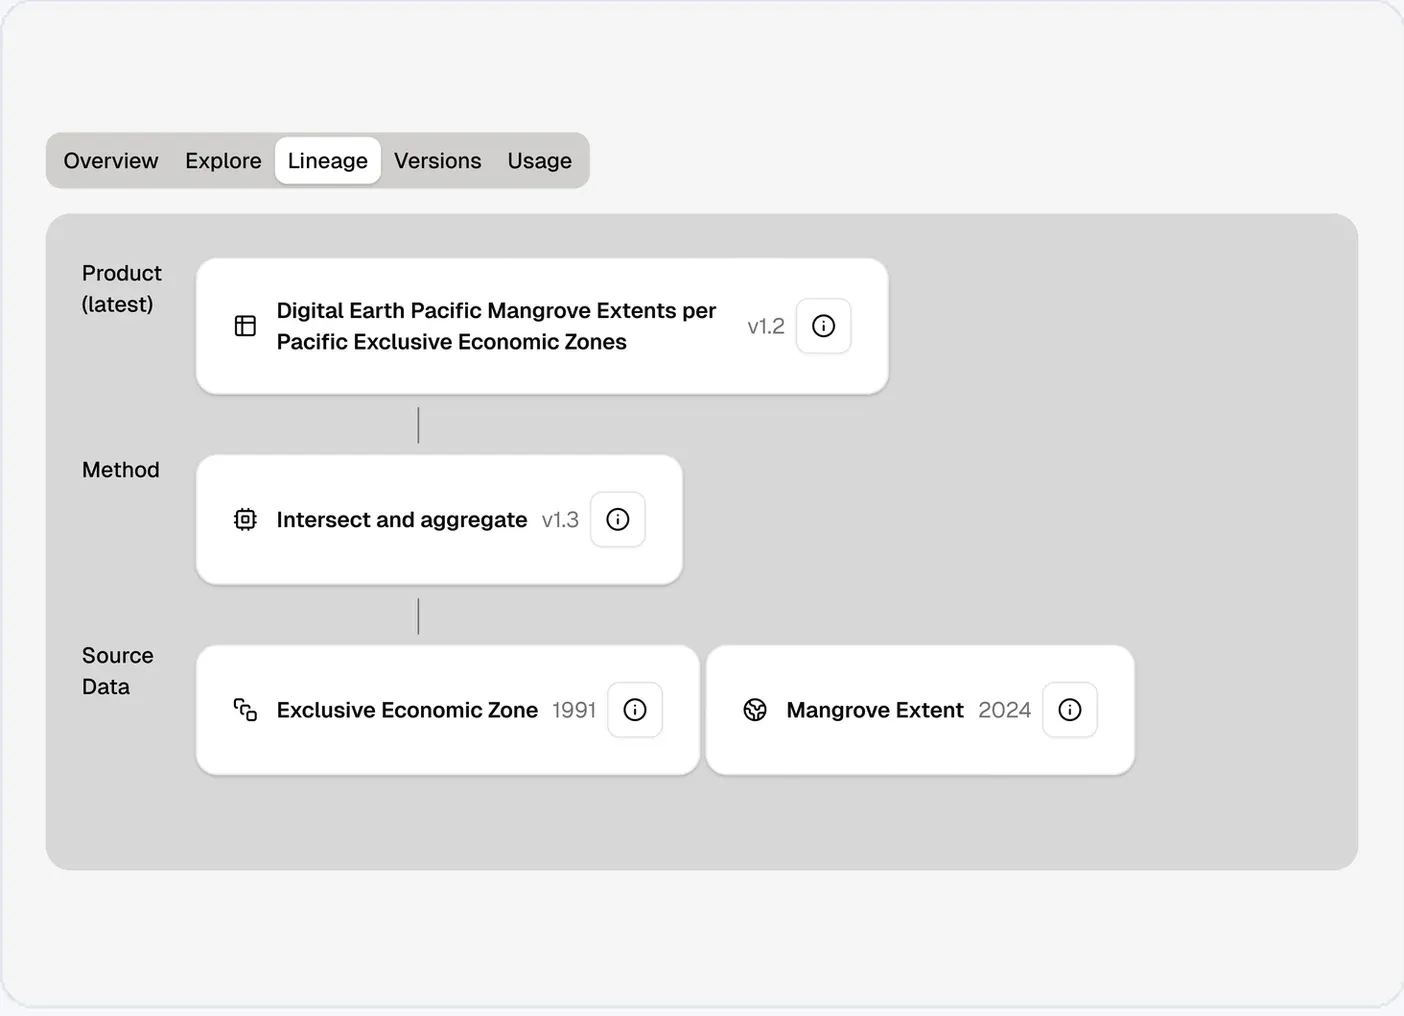
The platform needed to make complex information useful to decision-makers while maintaining the integrity of the underlying work. Data publication needed to be repeatable and traceable, with a clear provenance chain showing where information came from and how it had been processed.
Translating those requirements into an interface people could understand was a significant product and UX challenge.
Defining the platform experience
We worked with the project team to shape how people would move between the platform’s data catalogue, accounts, maps, analysis and supporting information.
The work considered the questions different users might bring to the platform, the relationships between datasets and ocean accounts, and the context needed to interpret the information responsibly.
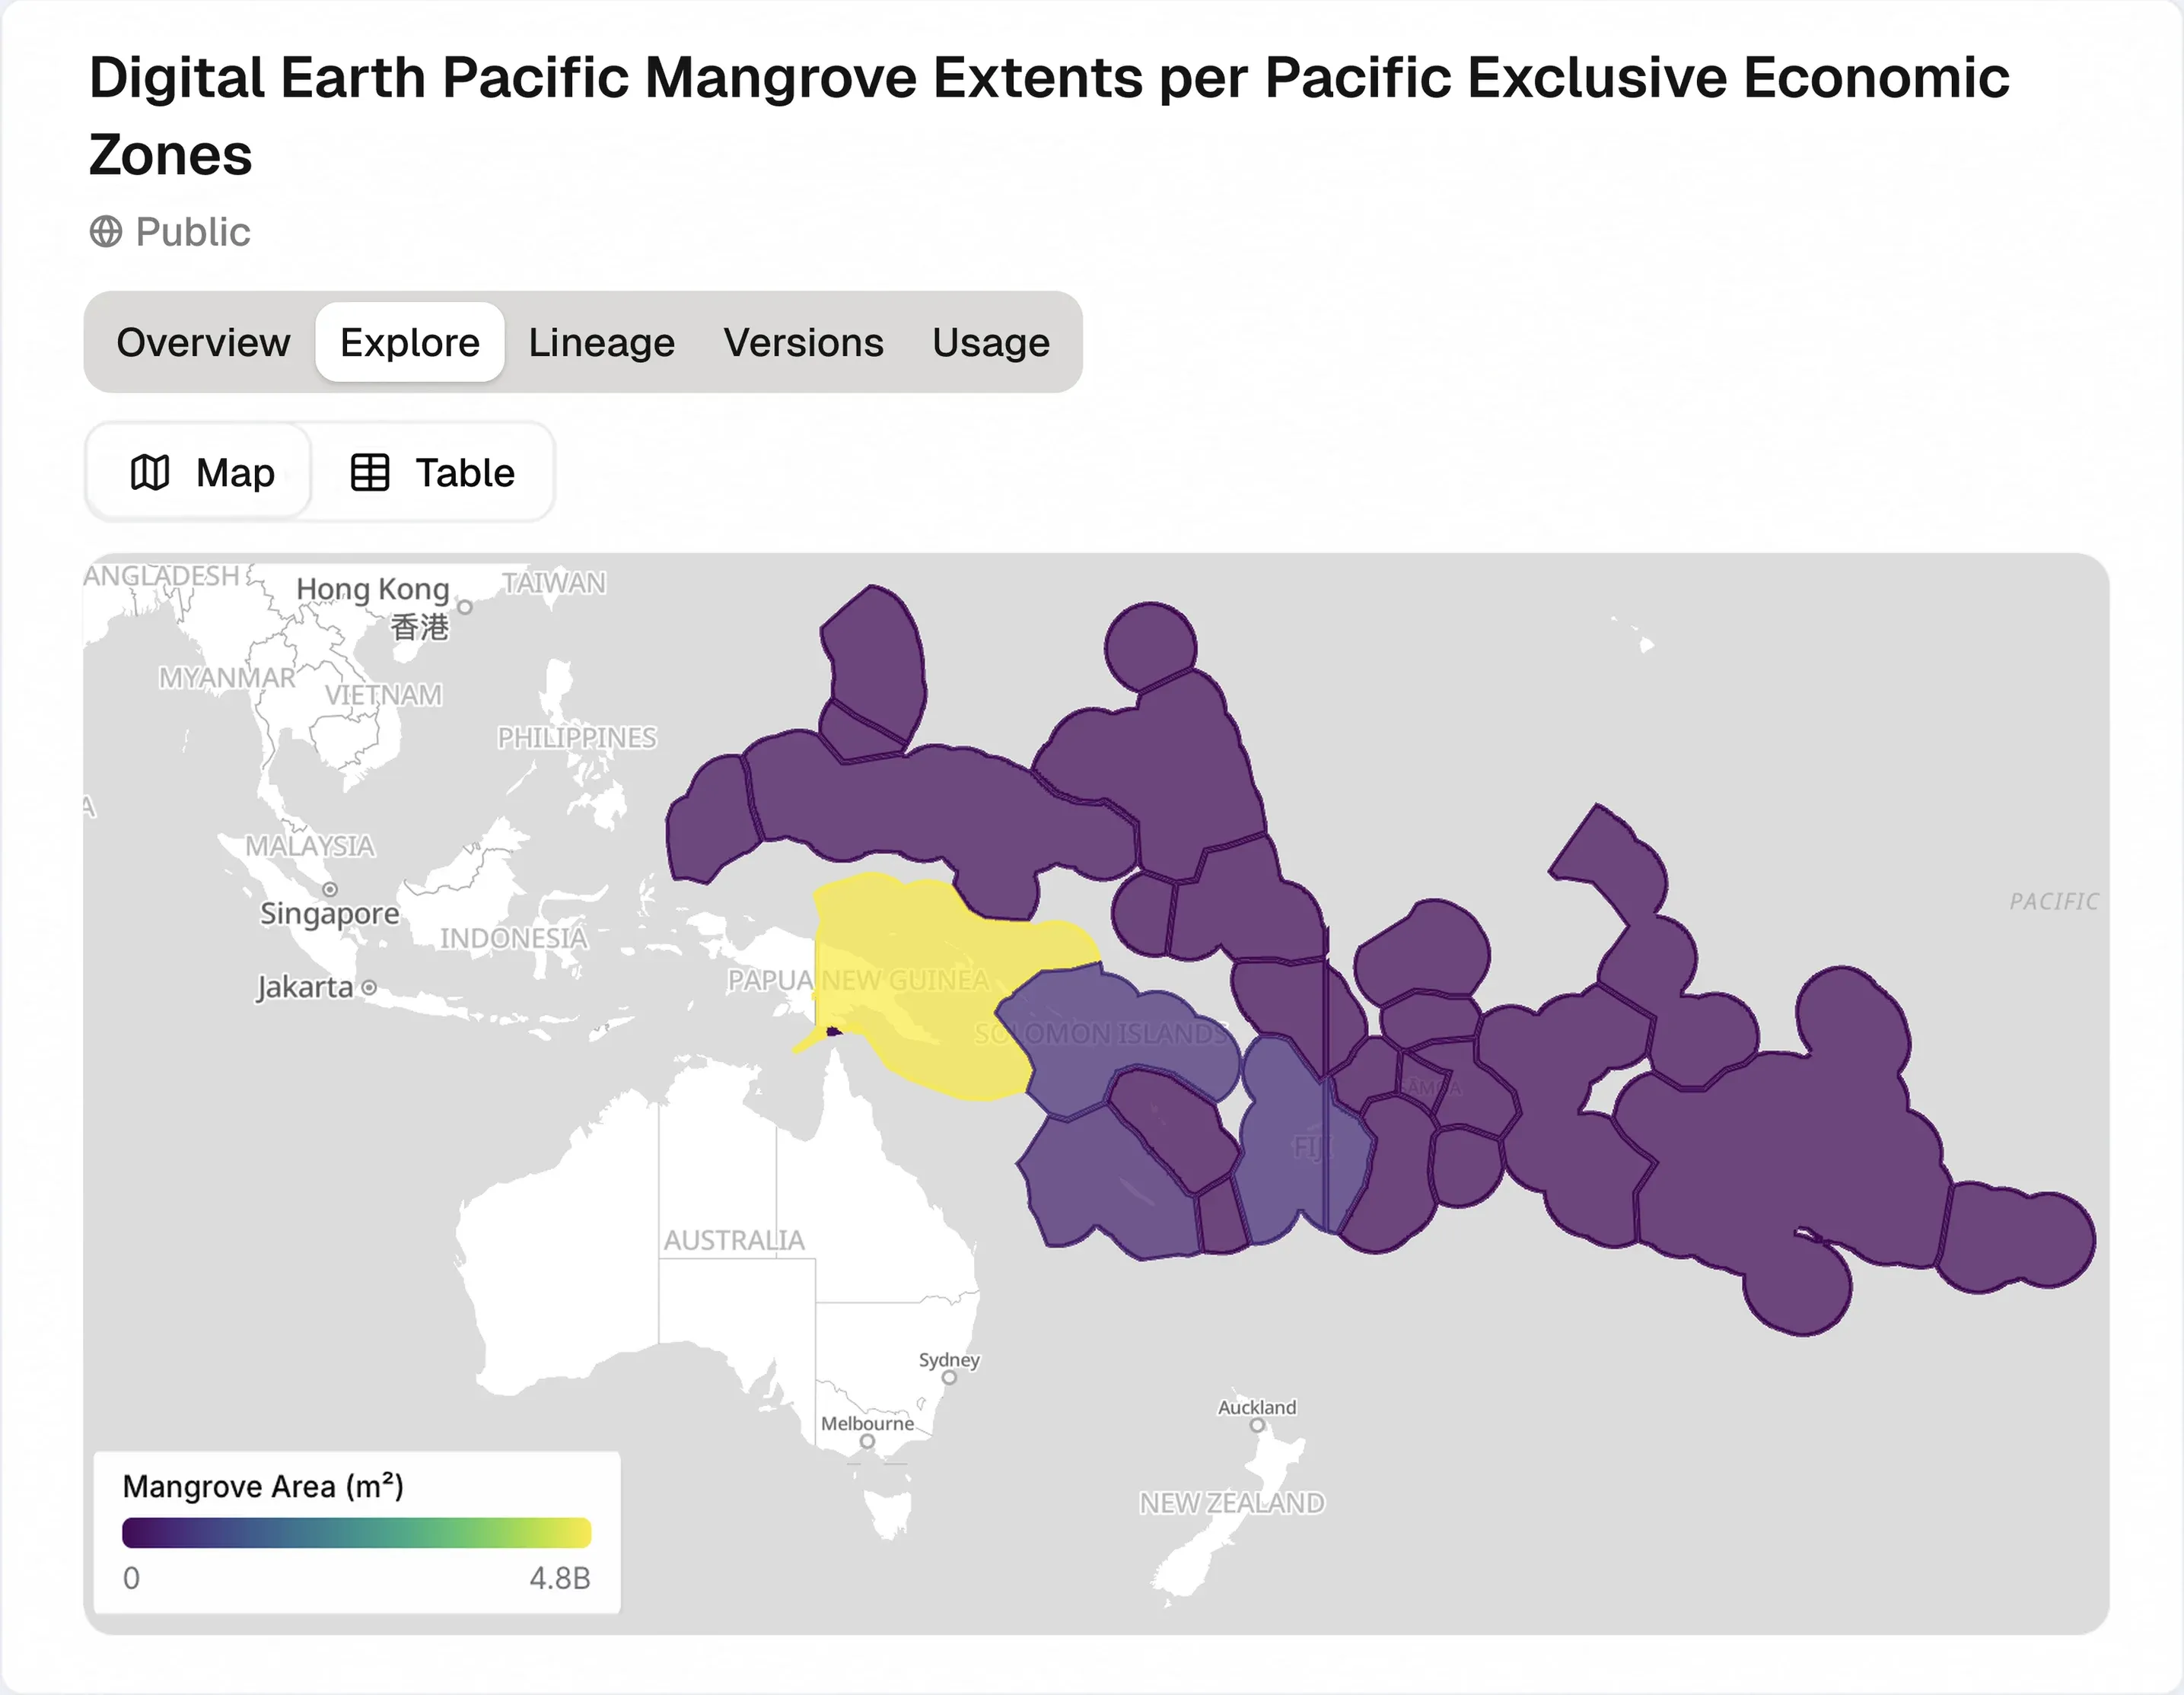
This created a clearer product structure for publishing and analysing information while supporting exploration across locations, themes and forms of evidence.
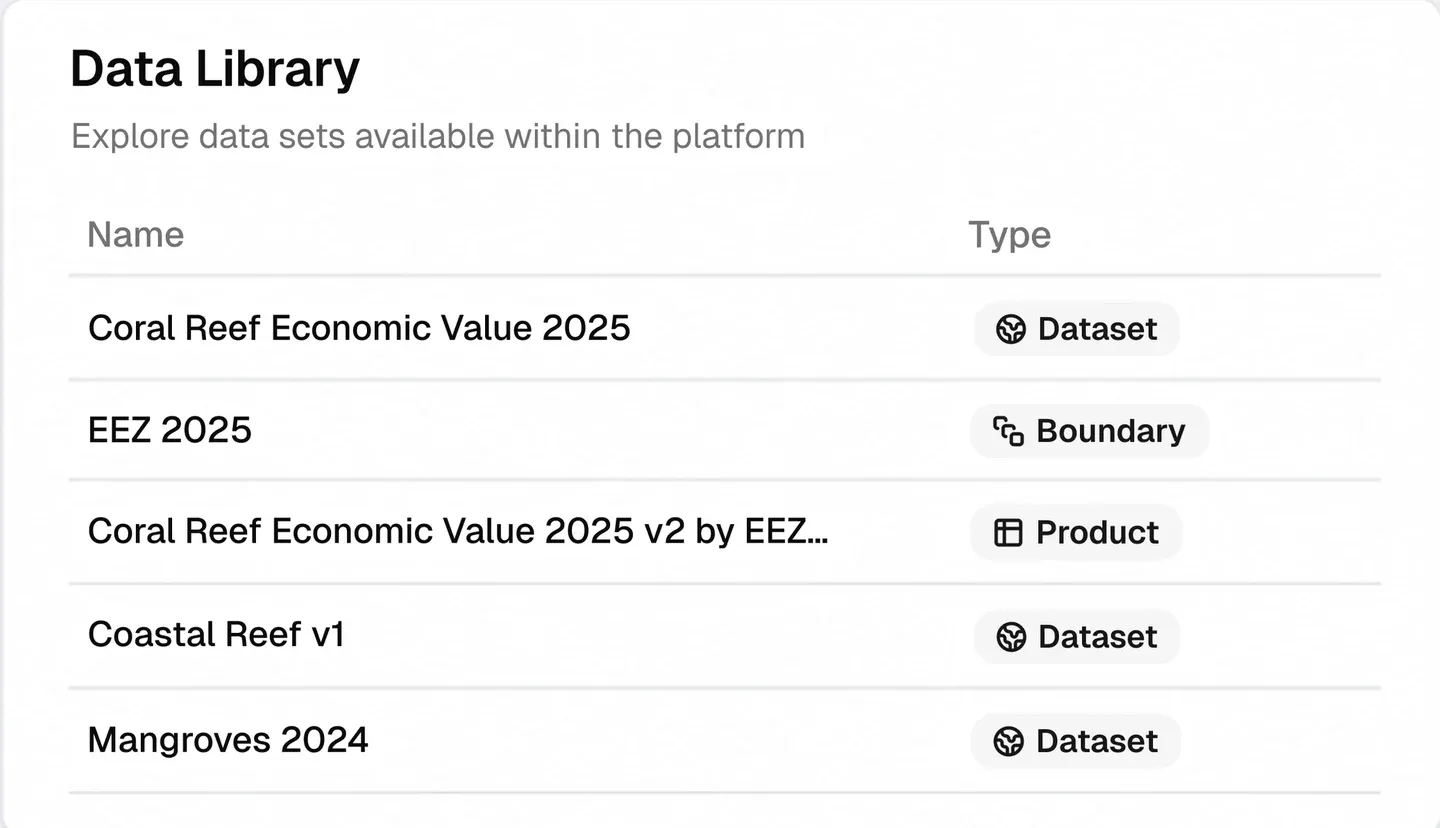
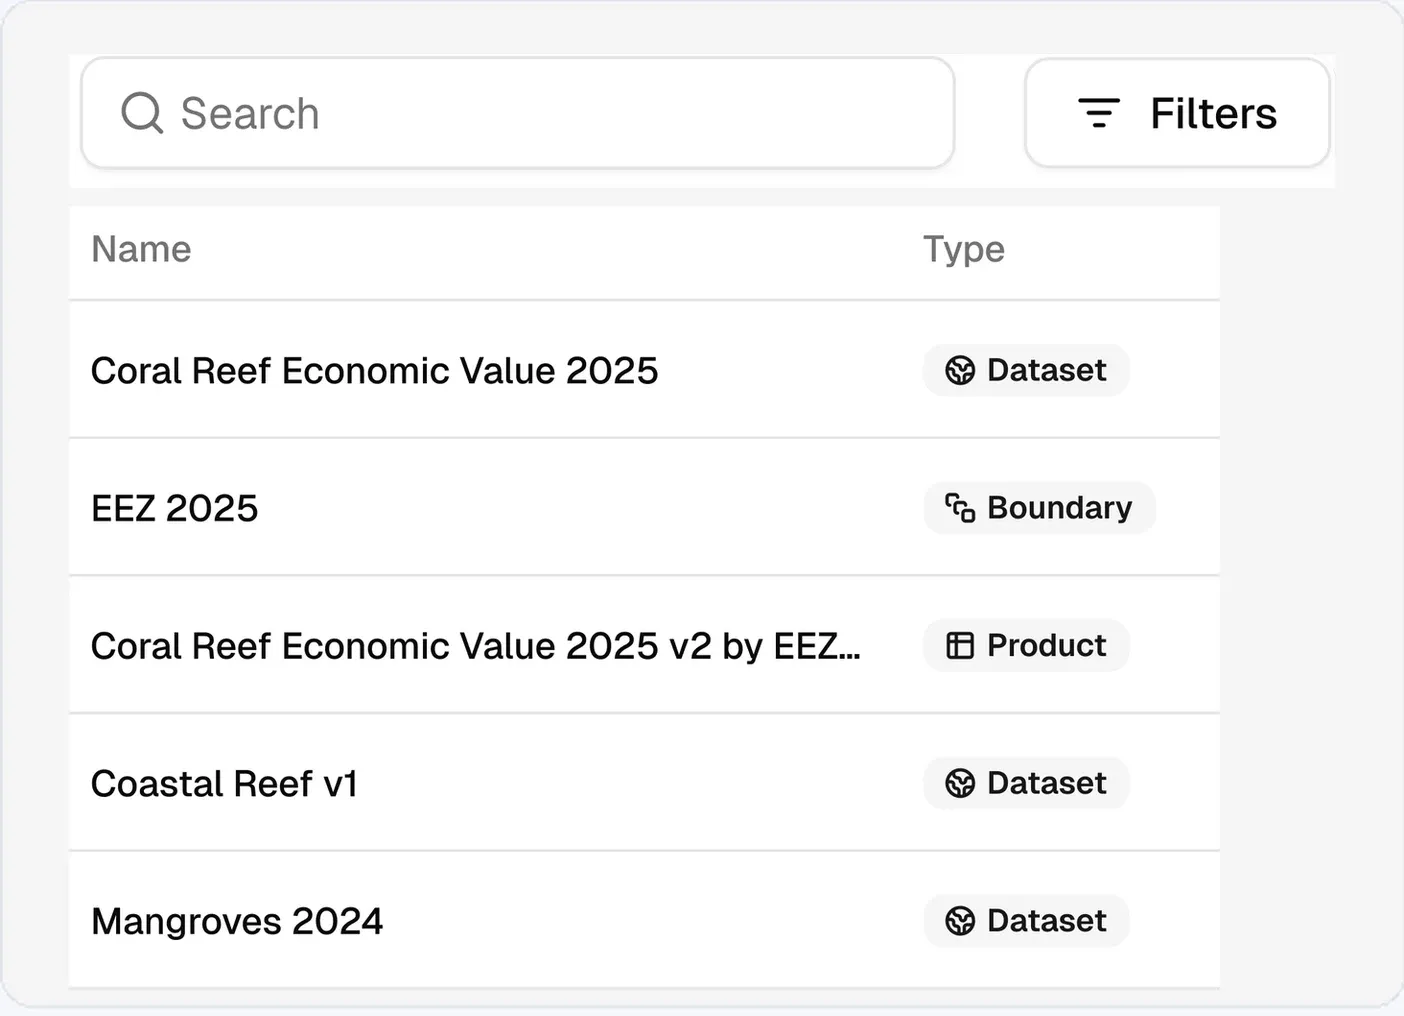
Discover data
Trace inputs and methods
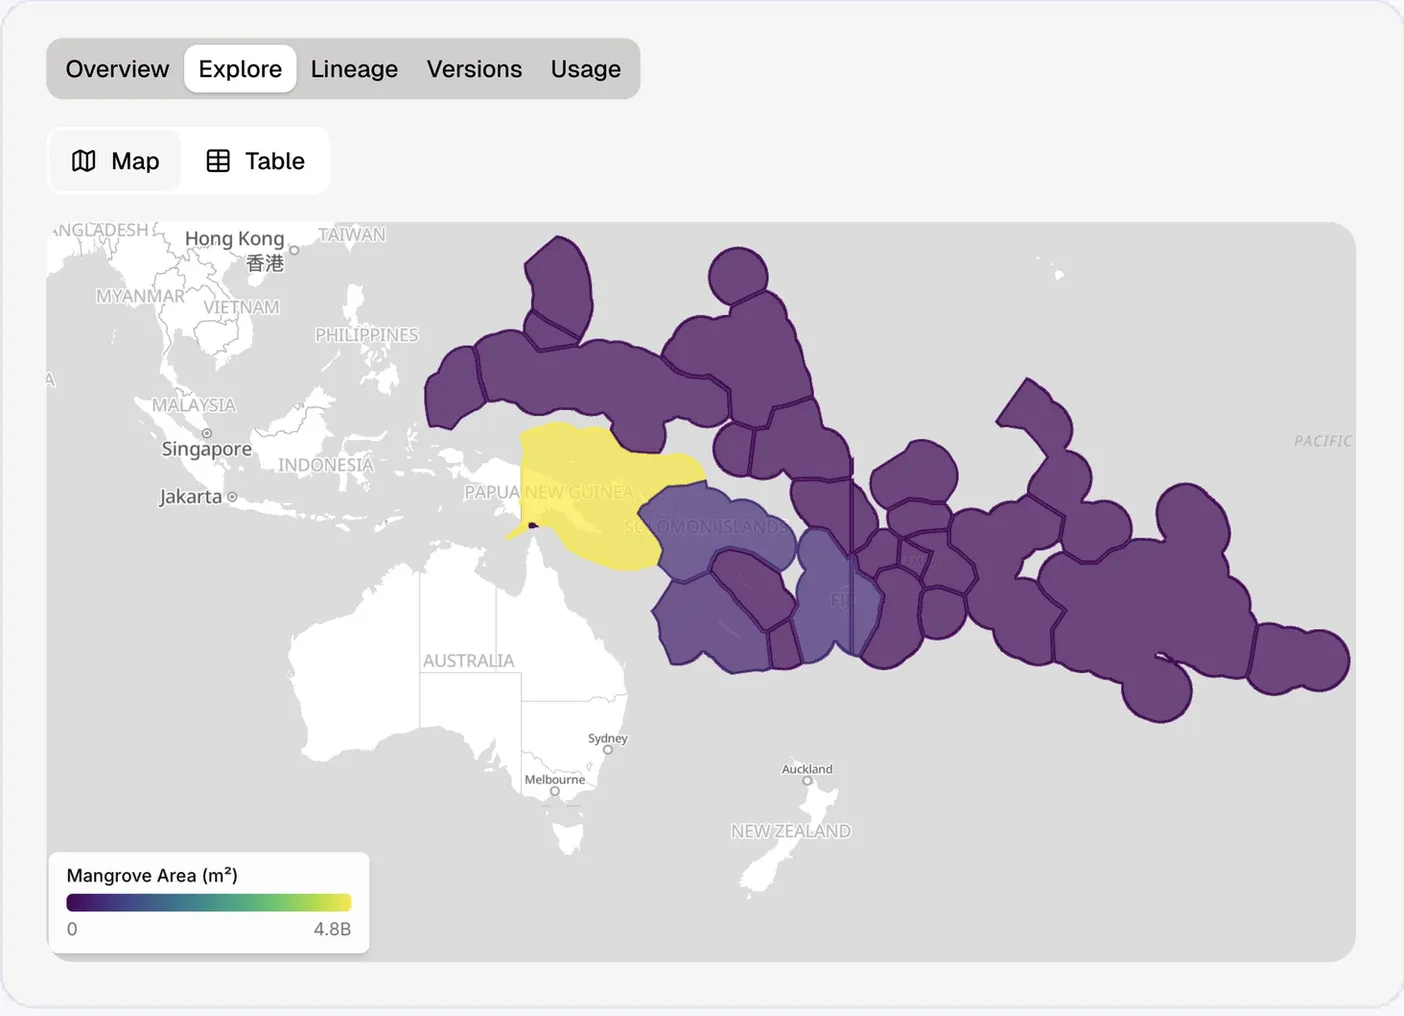
Explore spatially
Connecting complexity with a usable experience
Spatial and statistical information quickly becomes difficult to navigate when an interface simply reflects the structure of the underlying data.
We designed the experience around what people needed to find, understand and do. Information architecture, mapping, visualisation and interaction design were used to make the platform approachable without concealing the complexity or provenance of the information behind it.
The resulting concept connected the technical and academic requirements of the platform with an accessible decision-support experience.
Designing for open-source delivery
We facilitated workshops with the project team to establish the product direction and ensure the design reflected the values of the initiative.
This included adopting an open-source design foundation consistent with those values. We then worked alongside the Auspatious development team, providing continued product and design support as the concept moved into development.
This kept the intended experience connected to technical decisions and gave developers a considered system from which to build.
What the work established
- Product definition and platform structure
- Spatial information architecture
- Traceable and repeatable data-publishing workflows
- Data provenance within the user experience
- Data discovery, analysis and decision-support concepts
- Map, catalogue and dashboard designs
- UX and interface design
- Prototypes and implementation guidance
- An open-source design foundation aligned with the project’s values
- Product and design support for the development team
